There are two major economic downturns each century and one large depression every 172 years.
The Largest Debt Bubble in History

Above is a recent chart of the most in-debt countries in the world. The majority of them are bankrupt. And unfortunately, you can’t spend your way out of debt (contrary to what some economists think).
It’s generally agreed that the sustainability level for government debt is 60% of GDP. If you exceed that level it’s impossible to pay back the debt. In other words, you’re bankrupt.
That’s when GDP is in good shape. In a depression, of course, GDP dives and we go into a period of spiralling deflation. Deflation balloons debt. Governments will fight like crazy to avoid deflation because it’s absolutely the worst scenario for them.
Over the next few years, we’re going to see huge volatility within the world of finance. If you know where the world is headed and you’re prepared, you can capitalize on the massive changes ahead.
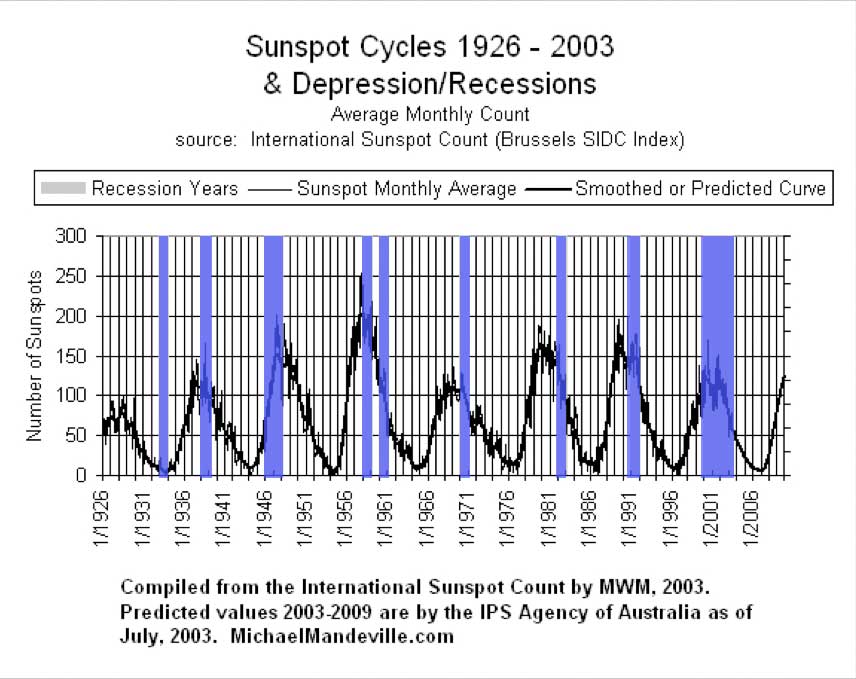
Solar Cycles and Recessions/Depressions
For the past several decades, sunspot maximums have been followed by either a depression or a recession.
International Debt
Here are some numbers (as June 2014) to keep in mind that will help position the gravity of the international debt problem (Care of the Economic Collapse Blog).
Most people tend to assume that the “authorities” have fixed whatever caused the financial world to almost end back in 2008, but that is not the case at all.
In fact, the total amount of government debt around the globe has grown by about 40 percent since then, and the “too big to fail banks” have collectively gotten 37 percent larger since then.
–$17,555,165,805,212.27 – This is the size of the U.S. national debt. It has grown by more than 10 trillion dollars over the past ten years.
–$32,000,000,000,000 – This is the total amount of money that the global elite have stashed in offshore banks (that we know about).
–$48,611,684,000,000 – This is the total exposure that Goldman Sachs has to derivatives contracts.
–$59,398,590,000,000 – This is the total amount of debt (government, corporate, consumer, etc.) in the U.S. financial system. 40 years ago, this number was just a little bit above 2 trillion dollars.
–$70,088,625,000,000 – This is the total exposure that JPMorgan Chase has to derivatives contracts.
–$71,830,000,000,000 – This is the approximate size of the GDP of the entire world.
–$75,000,000,000,000 – This is approximately the total exposure that German banking giant Deutsche Bank has to derivatives contracts.
–$100,000,000,000,000 – This is the total amount of government debt in the entire world. This amount has grown by $30 trillion just since mid-2007.
–$223,300,000,000,000 – This is the approximate size of the total amount of debt in the entire world.
–$236,637,271,000,000 – According to the U.S. government, this is the total exposure that the top 25 banks in the United States have to derivatives contracts. But those banks only have total assets of about 9.4 trillion dollars combined. In other words, the exposure of our largest banks to derivatives outweighs their total assets by a ratio of about 25 to 1.
–$710,000,000,000,000 to $1,500,000,000,000,000 – The estimates of the total notional value of all global derivatives contracts generally fall within this range. At the high end of the range, the ratio of derivatives exposure to global GDP is about 21 to 1.


Recent Comments